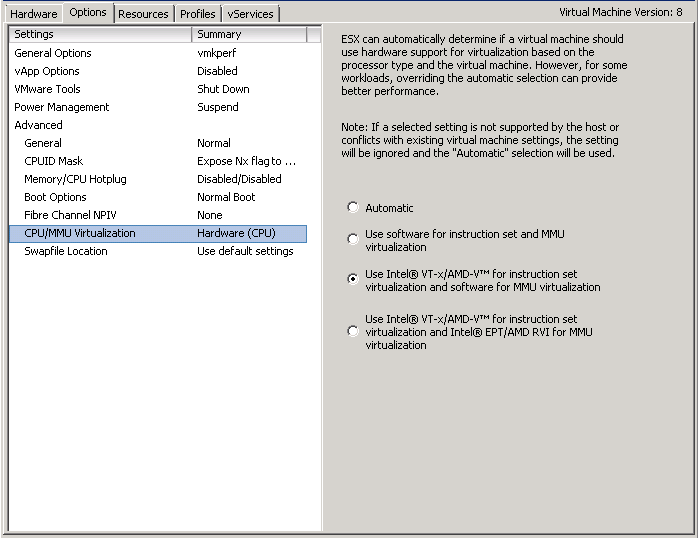
Hi folks! In this article, I would like to show you how to optimize the VMM mode for certain memory workloads. We will be using the widely unknown command line tool vmkperf to make an appropriate decision on the VMM mode for a specific VM. I assume you already have a basic knowledge about the two techniques for MMU (memory management unit) virtualization named shadow page tables and nested paging (aka Intel EPT or AMD RVI). If so, you are probably aware that you have the opportunity to intervene in the automatic mode selection the VMM performs upon VM start-up using vSphere Client. Set to “Automatic”, the VMM by default chooses the appropriate combination of CPU and MMU virtualization modes, usually trying to use hardware acceleration if available.
Selecting nested paging for MMU is not always the best choice depending on the memory workload inside the guest OS. A TLB-miss (translation look-aside buffer) causes a double page walk to perform the necessary address translation (virtual to guest physical, then guest physical to host physical) whereas without nested paging only a single page walk is necessary. As a result, you can say that frequent TLB misses – in either mode – have a negative impact on performance. The frequency at which TLB misses occur depends on the size of the TLB (the TLB caches address translations), the use of nested paging (with nested paging twice the amount of translations has to be stored) and the memory workload of the application. So, in order tell whether an application would be better off using shadow page tables, you have to monitor the number of TLB misses with and withoutnested paging and compare the results.
Hardware Performance Counters
Most modern CPUs provide special purpose registers used for monitoring hardware events. This counters have the advantage of providing insights into events that could not be given using ordinary profiling. The list of events that can be monitored depends on the CPU model and vendor and are identified by an event select and unit maskvalue. Those values can be taken from the chip manufacturer’s documentation. So far, I only used this way of monitoring with Intel CPUs, so I can only provide this link right now:
You will probably easily be able to find the equivalent document for AMD.
To monitor the number of TLB misses caused by memory load instructions you need the MEM_LOAD_RETIRED.DTLB_MISS event. The corresponding event select value is CB, the unit mask is 10 (both hexadecimal numbers).
vmkperf
ESXi provides a command line tool that allows us to monitor such events. It is the equivalent to the perf command on Linux systems used for exactly the same purpose. The vmkperf command is only accessible through a SSH connection to the ESXi host directly, not via vCLI or vMA. The tool allows you to monitor some pre-configured events, too, but TLB misses are not among them, so you have to manually specify the event select and unit maskfor that event (taken from the documentation mentioned above).
~ # vmkperf start tlb_misses -e 0xcb -u 0x10
This triggers the system to start monitoring the event referred to by 0xcb, 0×10 and will make it available by the name of “tlb_misses”. That name can be anything you like, it is used only for identification. The system will now count the number of occurred TLB miss events until you stop the process:
~ # vmkperf stop tlb_misses
After that, the CPU will stop counting events and all gathered data will be lost, so be sure to dump all information you need to a file prior to stopping the monitor.
Vmkperf has two sub-commands to read the actual values: read gives you the current values at that moment, while poll shows the same information but recurs at a given interval:
~ # vmkperf read tlb_misses
~ # vmkperf poll tlb_misses -i 1 -n 5
The second commands starts vmkperf polling the tlbmisses event at an interval of 1 second 5 times. Polling an event looks like this:
~ # vmkperf poll tlb_misses -i 1 -n 2 tlbmisses per second per cpu---------------------pcpu0 pcpu1 pcpu2 pcpu3 pcpu4 pcpu5 pcpu6 pcpu7 pcpu8 pcpu9 pcpu10 pcpu11 pcpu12 pcpu13 pcpu14 pcpu15 pcpu16 pcpu17 pcpu18 pcpu19 pcpu20 pcpu21 pcpu22 pcpu23 28622.00 7231.00 3460.00 4477.00 19768.00 2555.00 1292.00 24326.00 21024.00 1950.00 1590.00 2556.00 11711.00 2976.00 13674.00 2743.00 9760.00 1537.00 7886.00 6709.00 5979.00 2743.00 62532.00 15459.00 17772.00 2578.00 3781.00 6407.00 9146.00 17545.00 18997.00 5558.00 9636.00 1015.00 18443.00 2256.00 26749.00 1477.00 23046.00 4457.00 16079.00 2368.00 9898.00 5002.00 126539.00 1370.00 2286.00 8710.00
As you can see, the TLB miss counts are displayed for each pCPU including hyper threads (2 sockets * 6 cores * 2 hyperthreads = 24 pCPUs). I admit this is not the most allowing format for further analysis, but it is fairly easy to write a Perl script to do the conversion. Here is something that converts the output to CSV. This allows you to open the file in a spreadsheet software of you choice. [Download]
Isolated Experiment
In the section above, I showed you that you get the number of TLB miss events per pCPU not per VM. Therefore, the values are comprised of the events generated by multiple VMs as virtual machines have to share physical CPUs. In a perfect world, I would set up a completely isolated host with a single VM running on it. In that case, you would get very good results for that VM, but as you know the world is not perfect ![]() The best I could do with the hardware available is to free that host from VMs as good as possible and configure CPU affinity to the VM of interest. This is to avoid the scheduler’s load balancing mechanism to kick in potentially spreading the TLB misses across multiple CPUs. At least, this way I can be sure to have all TLB misses created by that VM accounted to the same pCPU. I pinned the VM to pCPU 23 (the last pCPU).
The best I could do with the hardware available is to free that host from VMs as good as possible and configure CPU affinity to the VM of interest. This is to avoid the scheduler’s load balancing mechanism to kick in potentially spreading the TLB misses across multiple CPUs. At least, this way I can be sure to have all TLB misses created by that VM accounted to the same pCPU. I pinned the VM to pCPU 23 (the last pCPU).
The workload inside the VM is not a real-world workload. Instead, I used a Linux VM with a Perl script to put the TLB under stress: tlbstress.pl_1

According to the values collected, the tlbstress.pl script creates around twice as many TLB misses with nested paging compared to shadow page tables. With around the 5.000.000 TLB misses per second the performance loss has to be tremendous!
In the Real World …
In the real world, you might not see values that conclusive. The number of TLB misses will most likely be lower and the difference between the two might not be that high. Further, the way I performed this experiment (CPU affinity) is not very applicable to the real world for several reasons:
- In a DRS cluster, you cannot use CPU affinity at all.
- The VM to monitor will likely have more than 1 vCPU which means TLB misses are spread across at least 2 pCPUs.
- The difference between the values measured will not be as high so that other VMs will have a higher influence on the values.
So I suggest an isolated experiment conducted for each VM under inspection! A big problem is the effort it makes to perform the monitoring and analysis. You can hardly do that for every single VM in your environment. You have to filter which VMs are worthy to take a close look at. Very generally speaking, applications that use a large amount of memory evenly (similar amount of access to all addresses) will likely cause many TLB misses (but the number might still be so small that changing the mode hardly makes a difference). Java-based web applications and databases are possible candidates for further inspection.
'OS' 카테고리의 다른 글
| [OS] rm에 대한 이해 (0) | 2014.05.28 |
|---|---|
| [OS] 디렉토리 권한이 777이면 다른 사용자의 파일을 삭제할 수 있다? (0) | 2014.05.28 |
| [OS] Permissions (0) | 2014.05.28 |
| [OS] syslog (0) | 2014.04.17 |
| /etc/shadow 파일에서 !와 !!, * 차이 (0) | 2014.04.02 |
| [OS] What is NUMA? (0) | 2014.03.14 |
| 메모리 관리 장치에 대하여 (0) | 2014.03.07 |
| Understanding Parallel Hardware: Multiprocessors, Hyperthreading, Dual-Core, Multicore and FPGAs (0) | 2014.03.07 |
| [OS] script 명령어를 이용한 터미널 세션 공유 (0) | 2014.01.29 |
| [OS] du -s 와 df 의 결과가 다른 이유 (0) | 2009.02.13 |