Oracle Tips by Burleson Consulting
April 11, 2010
Oracle technology is constantly changing, so don't miss my notes on updates to Oracle PGA behavior. Also see these important notes on over-riding the Oracle PGA defaults.
This is an excerpt on RAM sizing for Oracle from my bestselling book "Oracle Tuning: The Definitive Reference". In this book I have complete coverage of RAM management plus automated scripts for the initial sizing of your SGA and PGA regions.
If you want an automated tool, check-out Ion monitor for Oracle.
The goal of server optimization for any Oracle databases is to manage the RAM and CPU resources of the machine, and make sure that expensive RAM is not under-allocated.
When we talk about optimizing Oracle database performance in an MS-Windows environment, the techniques that we use are very similar to those used on larger UNIX/Linux platforms.
In my experience as an Oracle consultant, I see millions of dollars worth of RAM being wasted by Oracle shops. Because the Oracle DBA does not know how to accurately compute the RAM demands of the database, they under-allocate the RAM. On larger servers, RAM is still very expensive and depreciates regardless of use. The savvy Oracle professional knows how to accurately predict the high-water mark of RAM demands for their database, and fully allocates the RAM, reserving only enough to accommodate spikes in user connections.
RAM on UNIX/Linux Servers
On each UNIX dialect, there are specific commands that are required to display the RAM usage.
| Dialect of UNIX | RAM display command |
| DEC-UNIX | uerf -r 300 | grep -i mem |
| Solaris | prtconf|grep -i mem |
| AIX | lsdev -C|grep mem |
| Linux | free |
| HP/UX | swapinfo -tm |
RAM and Virtual Memory for Oracle
On all platforms, we need to ensure that the RAM processing demands of the Oracle database do not exceed the real RAM memory of the server. As we may know, all large servers use a Virtual Memory (VM) scheme to allow sharing of RAM resources. Oracle servers (Windows, UNIX, OS390) have a special swap disks to manage excessive RAM demands.
Virtual memory is an internal "trick" that relies on the fact that not every executing task is always referencing it's RAM memory region. Since all RAM regions are not constantly in-use, vendors have developed a paging algorithm that move RAM memory pages to the swap disk when it appears that they will not be needed in the immediate future.
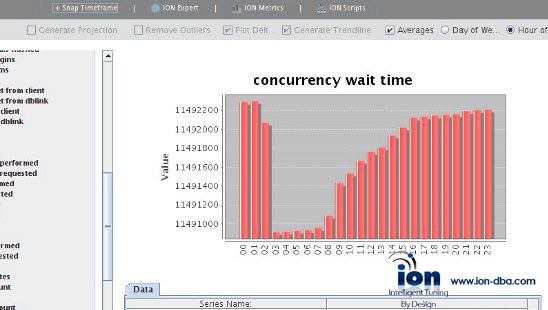
If you prefer a professional tool (with built-in intelligence) for optimizing SGA and PGA memory in Oracle, I highly recommend the Ion tool.

Using Ion to manage Oracle RAM consumption
In order to provide for the sharing of RAM, a special area of disk called a swap disk is required, and the primary purpose of the swap disk is to hold page frames from in active programs on disk. The purpose of the swap disk is to offload the least-frequently-used (LRU) RAM page frames so that many applications can concurrently share the same memory.
Once RAM pages from inactive programs are written to disk (a page-out), the operating system can make the freed RAM memory available for another active task. Later, when the inactive program resumes execution, the RAM pages are re-loaded from the swap disk into RAM (a page-in). This reloading of RAM pages is called swapping, and swapping is very time-consuming and degrades the performance of the target program.
While having the swap disk ensures concurrent RAM usage above the real amount of RAM, optimal performance requires that the swap disk is never used for active programs. This is because reading RAM pages off of the swap disk is about 14,000 times slower than reading the memory pages from directly from RAM. As we know, disk access is measured in milliseconds, or thousandths of the second, while RAM access is access to in nanoseconds, or billionths of a second.
In a VM architecture, the OS will write Ram to the swap disk, even thought the real RAM has not been exceeded. This is done in anticipation of a RAM shortage, and if a real RAM shortage occurs, the LRU RAM frames are already on the swap disk.
For an Oracle server, the goal is to keep all of the RAM memory demands of the database and database connections beneath the amount of physical RAM memory. In an Oracle environment, we can accurately control the amount of RAM memory that is used by the database instance System Global Area (SGA). This is because the Oracle database administrator can issue alter system command to change the RAM memory areas, and can grow and shrink the RAM memory areas on as needed basis.
We can see the allocated size of the SGA in the Oracle alert log, and it is also displayed on the console when Oracle is started as shown here:
SQL> startup
ORACLE instance started.
Total System Global Area 143421172 bytes
Fixed Size 282356 bytes
Variable Size 117440512 bytes
Database Buffers 25165824 bytes
Redo Buffers 532480 bytes
Database mounted.
Database opened.
We can also see the SGA RAM region by issuing the show sga command. In the example below we see that our total SGA size is 143 megabytes:
SQL> connect system/manager as sysdba
Connected.
SQL> show sga
Total System Global Area 143421172 bytes
Fixed Size 282356 bytes
Variable Size 117440512 bytes
Database Buffers 25165824 bytes
Redo Buffers 532480 bytes
Using the show sga command.
Next, let's see how we can quickly find the amount of RAM on our server.
Determining the RAM on your Oracle server
On most Oracle servers you can issue a few commands to see the amount of RAM. Let's look at a few examples.
Viewing Oracle RAM on IBM-AIX UNIX
In the IBM AIX dialect of UNIX, we have a two-step command to display the amount of available RAM memory. We start with the lsdev command to show all devices that are attached to the UNIX server. The lsdev command produces a large listing of all devices, but we can pipe the output from lsdev to the grep command to refine the display to only show the name of the device that has the RAM memory
root> lsdev -C|grep mem mem0 Available 00-00 Memory |
Here we see that mem0 is the name of the memory device on this AIX server. Now we can issue the lsattr -El command (passing mem0 as an argument) to see the amount of memory on the server. Below we see that this server has 2 gigabytes of RAM memory attached to the mem0 device.
root> lsattr -El mem0
size 2048 Total amount of physical memory in Mbytes False
goodsize 2048 Amount of usable physical memory in Mbytes False
Oracle RAM in Linux
In Linux, seeing available RAM is easy. The "free" command can be used to quickly display the amount of RAM memory on the server.
root> free
total used free shared buffers cached
Mem: 3728668 504688 3223980 41316 430072 29440
-/+ buffers/cache: 45176 3683492
Swap: 265032 608 264424
Usage note: For displaying RAM on Linux with the free command, note that the *second* data line ("-/+ buffers/cache") is the important one. Many people get confused by Linux using all "free" RAM for buffers, so the first line looks like the server is out of RAM.
Oracle RAM on MS-Windows
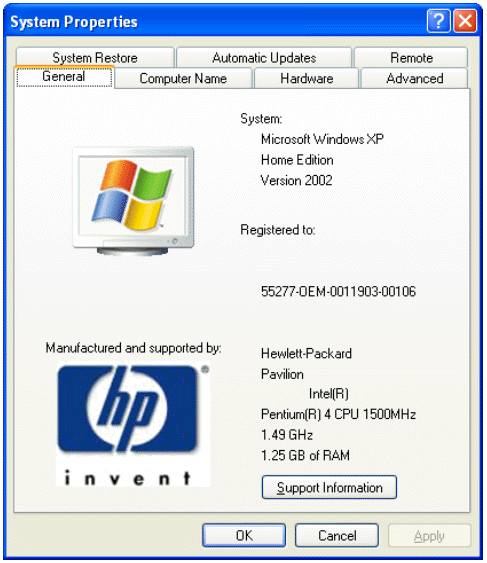
To see how much RAM you have on your MS-Windows server, you can go to start --> settings > control panel --> system, and click on the "general" tab (refer to Figure 1). Here we see that this server has 1,250 megabytes of RAM.

The MS-windows system display screen.
Now that we know how to tell the size of our MS-Windows RAM and the size of the SGA, we have to consider the RAM usage for Oracle connections.
Reserving RAM for Database Connections
The Oracle DBA can use math to determine the optimal RAM allocation for a MS-Windows server. For the purposes of this example, let's assume that we are on a dedicated MS-Windows Oracle server, and Oracle will be the only program running on the server. The total RAM demands for Oracle on MS-Windows are as follows:
-
OS RAM 20 percent of total RAM for MS-Windows, 10% of RAM for UNIX
-
Oracle SGA RAM determined with the show sga command
-
Oracle database connections RAM Each Oracle connection (when not using the Oracle multi-threaded server) will use two megabytes of RAM plus sort_area_size plushash_area_size. (or pga_aggregate_target alocation)
Once we know the total available RAM memory, we have to subtract 20 percent from this value for MS-Windows overhead. Even in an idle state, Windows services use RAM resources, and we must subtract 20% to get the real free RAM on an idle server.
Finding the High-water Mark of Oracle User Connections
Once we know the amount of available RAM for Oracle, we must know the high-water mark (HWM) for the number of Oracle connections. For systems that are not using Oracle's multithreaded server architecture, each connected session to the Windows server is going require an area of memory for the program global area, or PGA.
There is no easy way to determine the high-water mark of connected Oracle sessions. If you use Oracle STATSPACK you can get this information from the stats$sysstat table, but most Oracle DBAs make a generous guess for this value.
Determining the optimal PGA Size
In our example, we have 1,250 megabytes of RAM memory on our MS-Windows server, and less 20 percent, we wind up with the total available allocation for Oracle of One gig.
The size for each PGA RAM region is computed as follows:
-
OS Overhead - We reserve 2 meg for Windows and 1 meg for UNIX
-
Sort_area_size parameter value - This RAM is used for data row sorting inside the PGA
-
Hash_area_size parameter value - This RAM defaults to 1.5 time sort_area_size, and is used for performing hash joins of Oracle tables.
SQL> show parameters area_size
NAME TYPE VALUE
------------------------------------ ----------- ---------
bitmap_merge_area_size integer 1048576
create_bitmap_area_size integer 8388608
hash_area_size integer 1048576
sort_area_size integer 524288
workarea_size_policy string MANUAL
Display PGA area sizes.
Here we can see the values for sort_area_size and hash_area_size for our Oracle database. To compute the value for the size of each PGA RAM region, we can write a quick data dictionary query against the v$parameter view:
set pages 999;
column pga_size format 999,999,999
select
1048576+a.value+b.value pga_size
from
v$parameter a,
v$parameter b
where
a.name = 'sort_area_size'
and
b.name = 'hash_area_size'
;
A dictionary query to compute PGA size.
The output from this data dictionary query shows that every connected Oracle session will about 2.5 megabytes of RAM memory for the Oracle PGA.
PGA_SIZE
------------
2,621,440
Now, if we were to multiply the number of connected users by the total PGA demands for each connected user, we will know exactly how much RAM memory in order to reserve for connected sessions.
Getting back to our example, let's assume that we have a high water mark of 100 connects sessions to our Oracle database server. We multiply 100 by the total area for each PGA memory region, and we can now determine the maximum size of our SGA:
| Total RAM on Windows Server | 1250 MB |
| Less: | |
| Total PGA regions for 100 users: | 250 MB |
| RAM reserved for Windows (20 %) | 250 MB |
| ---------- | |
| RAM for SGA & buffers | 750 MB |
Hence, we would want to adjust the RAM to the data buffers in order to make the SGA size less than 750 MB. Any SGA size greater than 750 MB, and the server might start RAM paging, adversely affecting the performance of the entire server. The final task is to size the Oracle SGA such that the total memory involved does not exceed 750 MB.
Remember, RAM is an expensive server resource, and it is the job of the DBA to fully-allocate RAM resources on the database server. Un-allocated RAM wastes expensive hardware resources, and RAM depreciates regardless of usage.
As a review, the size of an Oracle SGA is based upon the following parameter settings:
-
shared_pool_size This sizes the administrative RAM for Oracle and the library cache.
-
db_cache_size This parameter determines the size of the RAM for the data buffers
-
large_pool_size The size used for shared servers (MTS, not recommended) and parallel queries. Parallel execution allocates buffers out of the large pool only whenparallel_automatic_tuning=true.
-
log_buffer The size of the RAM buffer for redo logs
A Script for estimating Total PGA RAM
In SQL*Plus, you can accept a parameter and then reference it inside your query by placing an ampersand in front of the variable name. In the simple example below, we declare a variable called myparm and direct SQL*Plus to accept this value when the script is executed:
set heading off
set echo on
accept myparm number prompt 'Choose a number between 1 and 10: '
select 'You chose the number '||&myparm from dual;
Our goal is to create a script called pga_size.sql. This script will prompt you for the high-water mark of connected users, and then compute the sum of all PGA RAM to be reserved for dedicated Oracle connections. In this example, we have a 2-meg overhead for MS-Windows PGA sessions.
Here is the finished script:
set pages 999;
column pga_size format 999,999,999
accept hwm number prompt 'Enter high-water mark of connected users:'
select
&hwm*(2048576+a.value+b.value) pga_size
from
v$parameter a,
v$parameter b
where
a.name = 'sort_area_size'
and
b.name = 'hash_area_size'
;
When we run the script, we see that we are prompted for the HWM, and Oracle takes care of the math needed to compute the total RAM to reserve for Oracle connections.
SQL> @pga_size
Enter the high-water mark of connected users: 100
old 2: &hwm*(2048576+a.value+b.value) pga_size
new 2: 100*(2048576+a.value+b.value) pga_size
PGA_SIZE
------------
362,144,000
Optimizing PGA for Oracle
When sizing your PGA it's easy to minimize the "disk sorts" metric (using a STATSPACK or AWR report), but we need to account for hash joins. The more PGA, the higher the propensity for Oracle to choose hash joins. You can use a script like this to track nested loop vs. hash joins, tracking rows processed, disk reads and CPU consumption:
select
to_char(sn.begin_interval_time,'yy-mm-dd hh24') c1,
count(*) c2,
sum(st.rows_processed_delta) c3,
sum(st.disk_reads_delta) c4,
sum(st.cpu_time_delta) c5
from
dba_hist_snapshot sn,
dba_hist_sql_plan p,
dba_hist_sqlstat st
where
see code depot for full script
The output below shows the number of total nested loop joins during the snapshot period along with a count of the rows processed and the associated disk I/O. This report is useful where the DBA wants to know if increasing pga_aggregate_target will improve performance.
Now that we understand sizing RAM regions for Oracle on Windows, let's look at how we can examine the RAM used by Windows during Oracle activities.
Monitoring Server Resources in MS-Windows
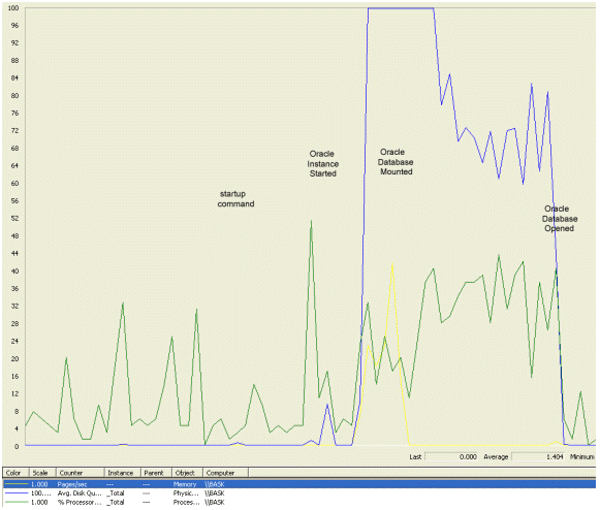
In MS-Windows we can use the performance manager screen to observe the resource consumption of the Oracle Windows server (refer to Figure 2). The performance manager is hidden deep inside the Windows menus, but can be found by following start > settings > control panel > administrative tools > performance.

The MS-Windows server performance monitor.
The MS-Windows performance monitor plots three metrics:
-
Green (CPU) - This is the percentage of CPU resources consumed
-
Yellow (RAM) - This is the number of RAM pages per seconds used
-
Blue (DISK) - This is the disk I/O queue length percentage
1. RAM Usage The yellow line is RAM usage, and we see the first spike in the RAM when the SGA is allocated and a short spike in RAM as the database is mounted.
2. DISK Usage The blue line is the disk I/O, and we see the disk I/O activity peg at the point where we mount the database. This is because Oracle must touch every data file header to read the system change number (SCN).
3. CPU Usage The green line is CPU and it is interesting to note that the CPU never goes above 50% during Oracle database startup.
Conclusion
In sum, the allocation of RAM memory for an Oracle server can be done solely with mathematics, and no expensive performance monitors are required. The most difficult part of Oracle RAM optimization in any environment is accurately predicting the high water mark of connected user sessions. If we have an unexpected spike of connected sessions, it is possible that we would exceed the amount of RAM on the server, causing active programs RAM regions to go out to the swap disk. The goal is to fully allocate RAM without ever experiencing RAM paging.
A script to display the memory used by any specific session would look something like this:
display_session.ram.sql
select
to_char(ssn.sid, '9999') || ' – ' || nvl(ssn.username,
nvl(bgp.name, 'background')) || nvl(lower(ssn.machine), ins.host_name) ssession,
to_char(prc.spid, '999999999') pid_thread,
to_char((se1.value / 1024) / 1024, '999g999g990d00') current_size_mb,
to_char((se2.value / 1024) / 1024, '999g999g990d00') maximum_size_mb
from
v$statname stat1,
v$statname stat2,
v$session ssn,
v$sesstat se1,
v$sesstat se2,
v$bgprocess bgp,
v$process prc,
v$instance ins
where
(See CODE DEPOT for full working script)
stat1.name = 'session pga memory'
and
stat2.name = 'session pga memory max'
and
se1.sid = ssn.sid
and
se2.sid = ssn.sid
and
se2.statistic# = stat2.statistic#
and
se1.statistic# = stat1.statistic#
and
ssn.paddr = bgp.paddr(+)
and
ssn.paddr = prc.addr(+);
Click for more details on displaying RAM memory used by an Oracle session.